GitHub Copilot is amazing… but you can’t just roll it out all of a sudden with no planin a large engineering organisation!
Flipping the switch on without a proper configuration would be plain dangerous (think about he risk of accepting licensed code without training on triaging), but once this is addressed the most common thing I am asked about is:
how do I measure the productivity impact of GitHub Copilot?
Let me be clear: this not about replacing people with Copilot or reducing teams thanks to the productivity increase. GitHub Copilot is a tool, and I believe in people who can deliver better rather than more. Someone who uses Copilot on average delivers better code, and it happens thanks to the fact that the state of flow is not interrupted and developers can focus on the real, hard problems of engineering today.
GitHub Copilot Metrics Viewer
Using the REST APIs is absolutely fine, but sometimes you need to start quickly and with something visual. The folks at GitHub developed metrics-viewer, an excellent React application you can deploy anywhere. It will be connected to your GitHub Organisation (or Project, if you like) and it will give you a fantastic breakdown of metrics for your teams.
I use metrics-viewer heavily and I recommend it against alternatives like a custom PowerBI dashboard as there is a significant integration with the service. I think it is an excellent tool.
You can also find PowerBI dashboards if you wanted to, of course!
In both cases you need a token with manage_billing:copilot and read:enterprise scopes.
Why it is so important
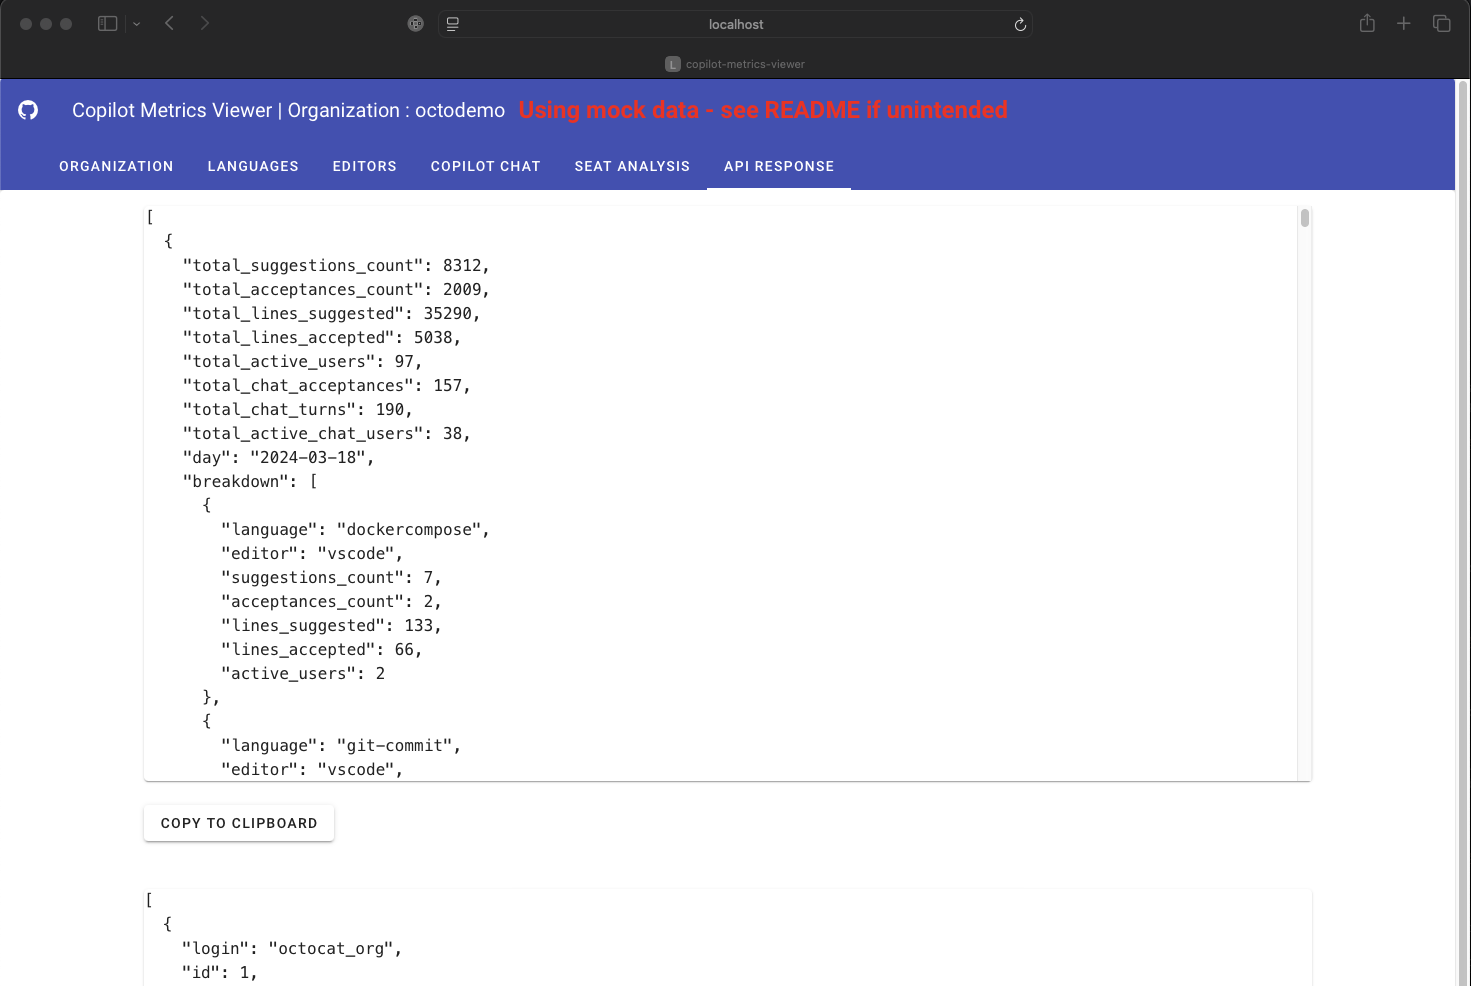
metrics-viewer (have a look at their README, it shows quite a lot!) is a single pane of glass where you can monitor acceptance rates, hotspots, active users, etc.
It gives you a breakdown of languages in use, IDEs, etc. but most importantly you can see the plain API responses so you can potentially include the logic in your own systems!